October 1, 2022
On June 28, the nonpartisan Congressional Joint Committee on Taxation released an overview of the federal tax system (https://www.jct.gov/publications/2022/jcx-14-2022/). The appendices were the most interesting part of the report.
For example, in 2021 estate and gift tax collections reached $27 billion, the highest that figure has been since 2008 ($28 billion). Although that may sound like a lot of money, it was only 0.7% of total federal collections, barely a rounding error. Estate and gift taxes have always been the smallest federal revenue stream. In 1972 they were 2.6% of total federal revenue, and the share has never been higher. Since 2009 it has never exceeded 1.0%.
Income taxes are mostly paid by the very rich. The top 1.5% of taxpayers, some 2,752 total, accounted for 51.8% of all federal income tax paid. Those with less than $50,000 in income scored in the report as having a negative income tax rate, because as a group their tax credits exceeded their liabilities.
But income taxes are only 54.2% of federal tax receipts, and the next big- gest share (30.3%) comes from social insurance taxes. The burden for these taxes is quite dif- ferent. Here the top 1.5% pay only 9.5% of the total. Those earning $100,000 to $200,000 provide nearly a third of social insurance tax payments. Expanding the group to include those from $50,000 to $200,000 accounts for 54.6% of such tax payments.
In 2010 the income tax accounted for only 41.5% of federal tax receipts, and social insurance 40.0%. Since then the govern- ment has increased its dependence on income taxes while holding social insurance taxes steady, so that now there more than a 20-point gap in their relative shares. Corporate taxes began the century at 10.2% of federal receipts, fell to 7.6% as the dot-com bubble burst, rose to 14.4% in 2006 before falling down to 6.6% in the Great Recession. The current share of 9.2% is about average for this century.
Federal taxes as a percentage of gross domestic product came to 18.1% in 2021, a recovery from the 16.3% in the pandemic year of 2020. The long-term average since 1952 for federal taxation has been 17.3%, so current taxation levels are above average. The high water mark of 20.0% was set in 2000, just before the internet bubble collapsed.
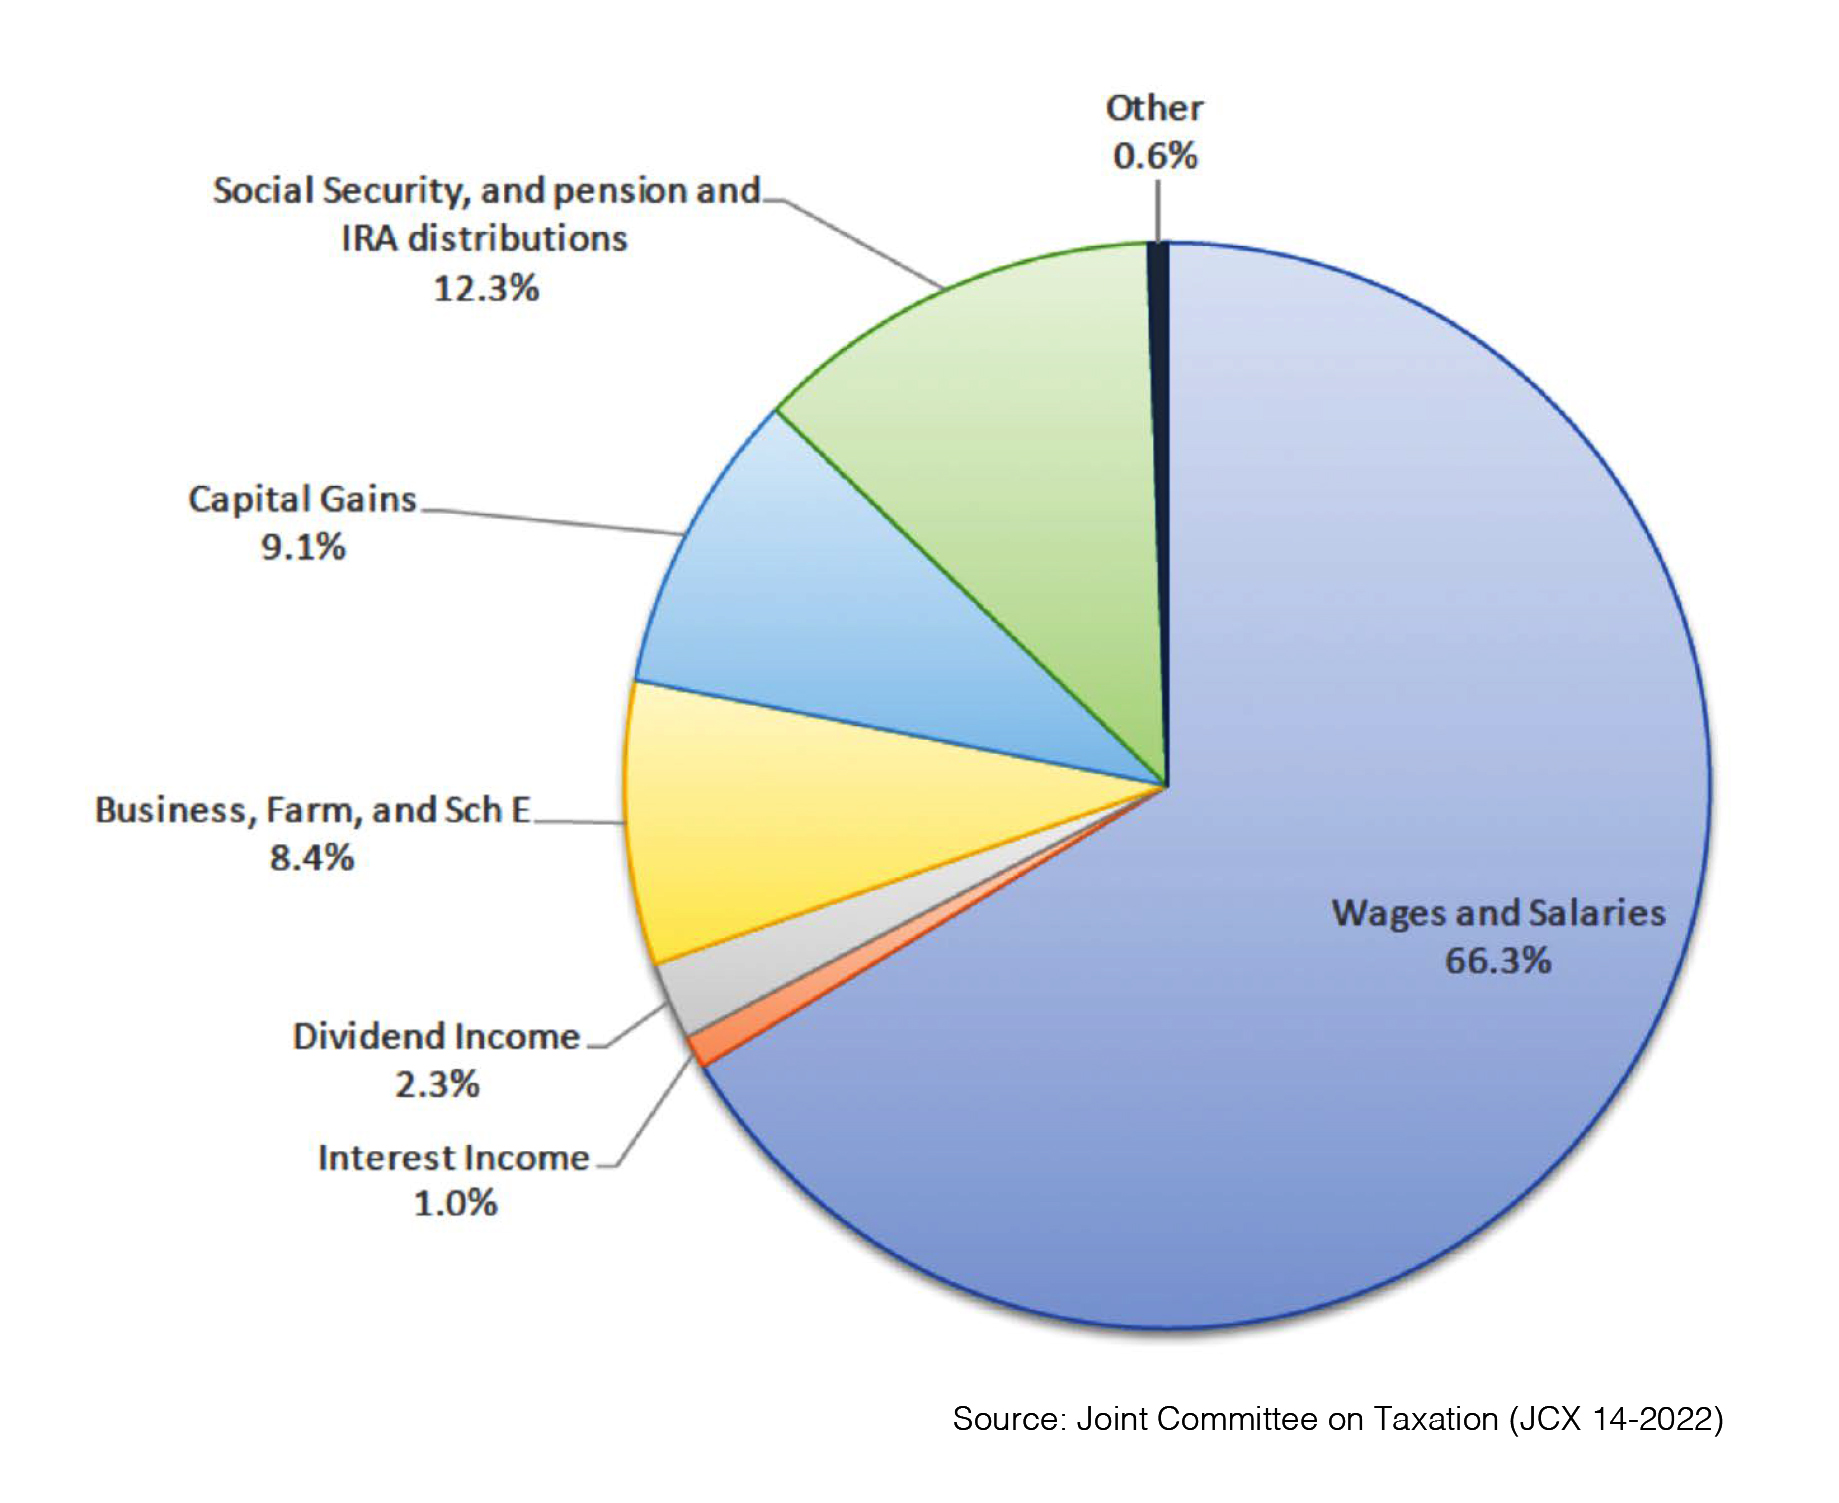
 The report also projected the sources of income for individual taxpayers for 2022. Interestingly, distributions from pensions, IRAs, and Social Security benefits will be larger than total realized capital gains, and nearly equal to capital gains plus dividends plus interest. See the graph for details.


